Are you looking for a trusted offline data analytics training institute in Bangalore? Aspire Techsoft stands out as a top choice for professionals who want real-world exposure, expert mentorship, and strong placement support for Data Analytics course in Bangalore
Course Duration
4 Months
Mode OF Training
Online / Classroom
100% Placement Assistance
Assured
Best Experienced Faculties
10+ years of Experienced
Course Duration 4 Months
Mode OF Training Online / Classroom
100% Placement Assistance
10+ Years Experienced Faculties
"Data Analytics Course in Bengaluru - Learn from real-time industry experts and launch a high-paying career. Bangalore is the Silicon Valley for India's leading IT industries, startups, and analytics-driven organizations. Whether you are looking to advance your career in analytics or enhance your current role, our Data Analytics course in Bengaluru provides both foundational and advanced analytics skills. Learn industry-ready skills with our in-depth Data Analytics course at Aspire Techsoft's Koramangala branch in Bengaluru, designed for freshers and working professionals. With practical training, expert guidance, and a globally recognized certification, this course is designed to equip you with the skills needed to secure high-paying job opportunities in Bengaluru, the technology hub of India . Data analytics is a comprehensive process of collecting, transforming, organizing, and examining raw data to find meaningful patterns and trends. Data analytics involves using various tools, technologies, and techniques from statistics, mathematics, and computer science. Data analytics basically helps businesses understand past events and make data-driven choices to identify future trends, optimize resources, and explore new opportunities. If you live in Bangalore and want to pivot your career into data analytics and hone your skills for high-paying analytics jobs, then Aspire Techsoft's Data Analytics course in Bengaluru is the launchpad for you. ";
Known as India’s Silicon Valley , Bangalore stands as the nation’s leading destination for technology and innovation. With over 10,000+ IT jobs available every month, along with jobs in the analytics sector, MNCs like Infosys, Accenture, Tata Consultancy Services, Wipro, Capgemini, Flipkart, IBM, and Razorpay are constantly hiring skilled Data Analysts.
Bangalore also hosts high-level data meetups, tech conferences, and analytics communities programs, which will be beneficial in boosting your career.
Studying a Data Analytics course at Aspire Techsoft's Koramangala Bangalore branch means networking opportunities, mentorship, and a fast-track career launch.
No prior experience required to learn the Data Analytics Course in Bangalore. If you have the basic skills in Basic Mathematics & Statistics, Comfort with Computers, Basic Programming, and Working with Spreadsheets, it will added advantage. Our Data Analyst course is Open to freshers and working professionals from any stream; IT and non‑IT people; “no coding-related experience needed.
Foundational knowledge for aspiring data analytics professionals, detailing that while formal education is not strictly required, skills in mathematics and statistics, spreadsheet software like Excel, basic programming with Python or R, Power BI ( business intelligence platform), database querying with SQL, and Tableau (data visualization) are highly beneficial.
Introduction to Data Analytics
Data Collection and Cleaning
Exploratory Data Analysis (EDA)
Statistical Analysis
Data Visualization
SQL for Data Analytics
Introduction to Programming (Usually Python or R)
Predictive Analytics & Machine Learning (Introductory Level)
Business Applications of Data Analytics
Up-to-date, job-ready Industry-Relevant Data Analytics Curriculum
100% Job-Oriented Data Analytics Training
Learn from Real-Time Industry Experts
Flexible weekend & weekday batches available
Hands-on Projects and Real-Time Case Studies
100% Placement Support
Free Demo Class – Feel the Difference
At Aspire Techsoft's data analytics training institute in Bangalore, you are trained on specialized cloud platforms like Microsoft Excel, Python, Power BI, Tableau, and BigQuery, technologies used across industries today.
The data analyst training here prepares students, as well as those looking to switch careers in this field, for specific career roles like data analyst, BI developer, and marketing analyst, with a focus on Bengaluru-specific recruitment trends and placement support.
More than 87% of data analyst roles in Bengaluru now prioritize tool-specific skills, according to a recent NASSCOM 2025 report.
Whether it's a job in Koramangala's IT startups or Whitefield's multinationals and Electronic City's global distribution centers, if you have skills specific to data analytics tools, you'll gain a faster path to placement.
Top Companies Hiring Data Analytics Tools in Bengaluru that are Mu Sigma, Fractal Analytics, Tiger Analytics, Tata Consultancy Services (TCS), Infosys, LatentView Analytics, EXL Analytics, Genpact, ZS Associates, Walmart Global Tech India, Google India (Bengaluru), Amazon India, Flipkart, IBM India, Deloitte India (Bengaluru Office), etc.
You don't need any prior IT experience to work in companies as a Data Analyst. Our Data Analyst course is designed to teach you the essential data tools and techniques.
Here you will get hands-on experience by working on real-world projects with 10+ industry experts, which will also help you build a strong portfolio.
Aspire Techsoft is the best Data Analyst training institute in Bangalore, where you will also get resume building and interview preparation skills, which will give you the confidence to get good job opportunities in Bangalore.
Data Analyst
Business Analyst
Marketing Analyst
Financial Analyst
SQL Analyst
Product Analyst
Junior Data Scientist
By registering here, I agree to AspireIT Terms & Conditions and Privacy Policy
• Excel Interface Overview
• Navigating the Ribbon
• Understanding Worksheets and Workbooks
• Creating and Saving Workbooks
• Data Entry and Editing
• Customizing the Quick Access Toolbar
• Excel File Formats
• Basic Arithmetic Formulas (SUM, SUBTRACT, MULTIPLY, DIVIDE)
• AutoSum Function, Cell References (Relative, Absolute, Mixed)
• Common Statistical Functions (AVERAGE, MEDIAN, MODE)
• Text Formulas (CONCATENATE, LEFT, RIGHT)
• Date Formulas (TODAY, NOW, DATE)
• Logical Formulas (IF, AND, OR)
• Conditional Formatting Rules
• Highlighting Cells Based on Values
• Data Bars, Color Scales, and Icon Sets
• Custom Conditional Formatting
• Managing Conditional Formatting Rules
• Using Formulas in Conditional Formatting
• Applying Conditional Formatting to Pivot Tables
• IF Statements, Nested IF Statements, AND, OR Operators, NOT Operator
• Combining Multiple Conditions
• Using IF with Text, Numbers, and Dates
• Conditional Formatting with Logical Operators
• CONCATENATE (or CONCAT), LEFT, RIGHT, MID, LEN, and TRIM
• UPPER, LOWER, PROPER
• SUBSTITUTE and REPLACE
• FIND and SEARCH
• TEXT Function for Formatting Numbers and Dates
• TODAY and NOW
• DATE and TIME
• DAY, MONTH, YEAR, HOUR, MINUTE, SECOND
• DATEDIF, NETWORKDAYS, EDATE, and EOMONTH
• Creating and Formatting Excel Tables
• Table Styles and Options
• Sorting and Filtering Tables
• Adding and Removing Table Rows/Columns
• Structured References
• Table Calculations and Totals
• Converting Table to Range
• Creating Dynamic Tables
• Using Table Formulas
• Advanced Filtering Techniques
• Using Slicers with Tables
• Advanced Sorting Techniques
• Working with Subtotals
• Merging and Splitting Tables
• Creating Pivot tables, PivotTable Fields and Areas
• Grouping Data in PivotTables
• Pivotable Calculations (Sum, Count, Average)
• Creating Pivot Charts
• Filtering Pivot tables with Slicers and Timelines
• Advanced Pivotable Techniques (Calculated Fields, Custom Calculations)
• Understanding Cell References
• Using Relative References
• Using Absolute References
• Mixed References
• INDIRECT Function
• OFFSET Function
• Linking Cells Between Sheets and Workbooks
• Introduction to LookUp Functions
• VLOOKUP Basics
• HLOOKUP Basics
• Using VLOOKUP with Exact and Approximate Match
• Combining VLOOKUP with Other Functions
• Common VLOOKUP Errors and Fixes
• Alternatives to VLOOKUP (INDEX and MATCH)
• Creating Basic Charts (Column, Line, Pie)
• Customizing Chart Elements (Titles, Legends, Labels)
• Using Sparklines for Miniature Charts
• Creating Combo Charts
• Using Conditional Formatting for Data Visualization
• Creating Heat Maps
• Using Data Bars and Color Scales
• What is a Power Query?
• Power Query Interface Overview
• Loading Data into Power Query
• Basic Data Transformation (Filter, Sort, Remove Columns)
• Combining Data from Multiple Sources
• Data Profiling in Power Query
• Saving and Loading Data to Excel
• Navigating the Power Query Editor
• Applying Basic Transformations (Replace Values, Remove Duplicates)
• Advanced Transformations (Pivot/Unpivot, Group By)
• Creating Custom Columns
• Merging Queries
• Appending Queries
• Managing Query Steps
• Creating Column Charts
• Creating Line Charts
• Creating Pie Charts
• Creating Bar Charts
• Creating Area Charts
• Creating Scatter Plots
• Customizing Chart Types and Style
• Data Preparation and Cleaning
• Using PivotTables for Reports
• Combining Multiple Data Sources
• Adding Visual Elements (Charts, Sparklines)
• Creating Interactive Dashboards
• Automating Report Updates
• Distributing and Sharing Reports
• Overview of Power BI and its components
• Power BI service vs. Power BI Desktop
• Benefits of using Power BI for data analytics
• Key features and capabilities of Power BI
• Understanding the Power BI ecosystem
• User interface and navigation
• Basic concepts and terminology in Power BI
• System requirements for Power BI Desktop
• Step-by-step installation guide
• Initial setup and configuration
• Updating Power BI Desktop
• Troubleshooting common installation issues
• Licensing and subscription options
• Importing sample datasets for practice
• Supported data sources in Power BI
• Connecting to databases, cloud services, and files
• Data import methods and best practices
• Managing data connections
• Data refresh and scheduling
• Handling data privacy and security
• Using Power BI gateways
• Types of visualizations available in Power BI
• Creating basic charts and graphs
• Customizing visualizations (colors, labels, titles)
• Using slicers and filters
• Creating and managing dashboards
• Adding interactivity to visualizations
• Publishing and sharing reports
• Using advanced chart types (waterfall, funnel, gauge)
• Creating and using bookmarks
• Implementing drill-through functionality
• Using custom visuals from the marketplace
• Creating dynamic visualizations with DAX
• Advanced interactivity techniques
• Combining multiple visualizations in a single report
• Introduction to DAX: Calculated Columns, Measures, and Tables
• Time Intelligence Functions
• Filtering Functions
• Advanced Calculations and Complex DAX Queries
• Optimizing DAX Queries for Performance
• Practical Applications of DAX in Data Models
• Overview of Power Query and its interface
• Connecting to various data sources
• Understanding the M language
• Basic data import and transformation
• Using the query editor for data preparation
• Managing and combining queries
• Best practices for efficient data queries
• Introduction to SQL
• Setting up the SQL environment
• Basic SQL Commands
• Creating and Deleting Databases and Tables
• Importing and Exporting Data from CSV Files
• Anatomy of SQL Query
• SQL Data Types and Operators
• Filtering and Sorting Data in SQL
• Aggregate functions in SQL
• Grouping Data – GROUP BY
• HAVING
• Subqueries
• Joining tables using INNER JOIN, LEFT JOIN, RIGHT JOIN & FULL OUTER JOIN
• Alias in SQL queries
• Working with Multiple Tables Using Subqueries
• Using Set Operators
• Aggregating Data from Multiple Tables using GROUP BY and HAVING.
• Advanced Join Techniques
• Joining multiple tables
• Handling duplicate records and eliminating duplicates
• Using UNION and UNION ALL to combine data from multiple tables
• Mathematical Functions
• Type Conversion Functions
• Using CASE Statements to Perform Conditional Operations
• Working with date/time data in SQL
• Date/time functions
• Formatting date/time data
• String manipulation functions (e.g. UPPER, LOWER, LEFT, RIGHT, etc.)
• Regular expressions in SQL for string operations
• Using CONCAT_WS to concatenate strings with a separator
• Syntax of Windows Function
• Ranking functions (e.g. ROW_NUMBER, RANK, DENSE_RANK, etc.)
• Aggregate functions using windows (e.g. SUM, AVG, MAX, MIN, etc.)
• Partitioning data for window functions
• Understanding the difference between row-based and aggregate-based window functions
• Common Table Expressions(CTE)
• Recursive CTEs for Hierarchical Data
• Combining CTEs with Window Functions and Subqueries
• Understanding the Performance Implications of CTEs
• Understanding The Relational Model and Database Schema Design
• Normalization and Denormalization of Database Tables
• Database Administration Tasks
• Implementing Indexes and Constraints for Data Integrity
• Designing Efficient Database Queries for Performance Optimization
• Overview of Alteryx
• Key Features and Benefits
• Use Cases and Applications
• Comparison with Other Data Analytics Tools
• Alteryx Designer Interface
• Licensing and Pricing
• Alteryx Community and Resources
• System Requirements
• Step-by-Step Installation Guide
• Post-Installation Configuration
• Licensing and Activation
• Troubleshooting Common Installation Issues
• Updating Alteryx
• Uninstalling Alteryx
• Input Data Tool
• Output Data Tool
• Directory Tool
• Text Input Tool
• Download Tool
• SharePoint Input Tool
• Blob Input Tool
• Data Cleansing Tool
• Filter Tool
• Select Tool
• Sort Tool
• Sample Tool
• Unique Tool
• Generate Rows Tool
• Join Tool
• Union Tool
• Find Replace Tool
• Append Fields Tool
• Make Group Tool
• Fuzzy Match Tool
• Spatial Match Tool
• Cross Tab Tool
• Transpose Tool
• Formula Tool
• Multi-Field Formula Tool
• Running Total Tool
• Tile Tool
• Imputation Tool
• Table Tool
• Charting Tool
• Layout Tool
• Render Tool
• Report Map Tool
• Text Box Tool
• Email Tool
• Connect In-DB Tool
• Data Stream In Tool
• Filter In-DB Tool
• Formula In-DB Tool
• Join In-DB Tool
• Summarize In-DB Tool
• Write Data In-DB Tool
• Comment Tool
• Tool Container
• Block Until Done Tool
• Message Tool
• Summarize Tool
• Tool Annotation
• Metadata Output Tool
• Designing a Workflow
• Best Practices for Workflow Management
• Debugging and Error Handling
• Workflow Automation
• Performance Optimization
• Sharing & Collaboration
• Real-World Workflow Examples
By registering here, I agree to AspireIT Terms & Conditions and Privacy Policy
Mock interviews by Aspireit give you the platform to prepare, practice and experience the real-life job interview. Familiarizing yourself with the interview environment beforehand in a relaxed and stress-free environment gives you an edge over your peers.
In our mock interviews will be conducted by Data Analytics industry experts in Bengaluru with an average experience of 10+ years. So you’re sure to improve your chances of getting hired!
Know more about Successfull Students ...
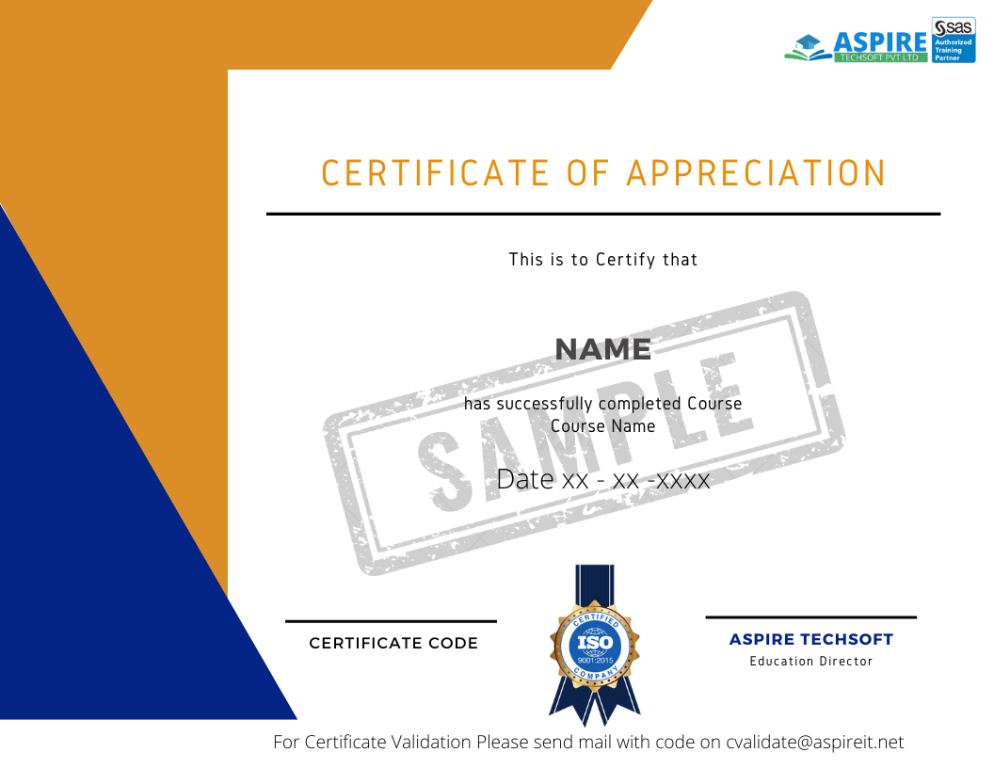
When you complete the Data Analytics course in Bengaluru at Aspire Techsoft's Koramangala Branch and complete the hands-on project, you will receive an ISO certificate that you can share with potential employers and your professional network.
Talk about it on Linkedin, Twitter, Facebook, boost your resume or frame it- tell your friend and colleagues about it.
Share your Certification with potential employers to show off your skills and capabilities
Most data analyst roles use tools like Advanced Excel, Power BI, Tableau, and Python, which require minimal coding.
Aspire Techsoft Koramangala branch is the best data analytics training institute in Bangalore. Here you will get high-quality data analytics training with 100% placement support.
By registering here, I agree to AspireIT Terms & Conditions and Privacy Policy